|
|
HowTos << HowToMakeVWGraphs | Software Overview | Sitemap | Downloads | Developers | Forums |
|
|
How To Make Virtual Wiring Graphs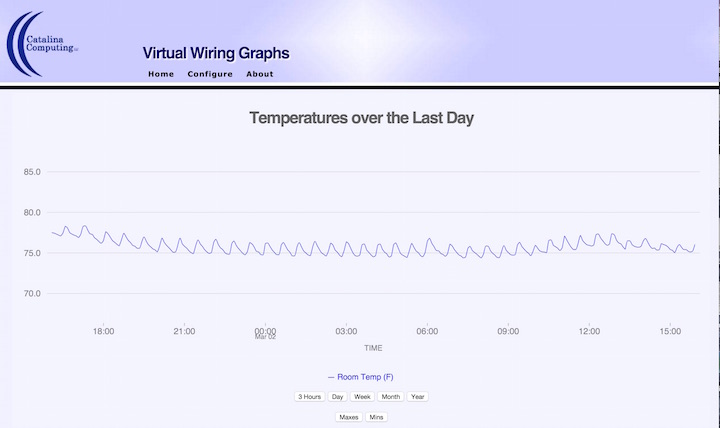
Want graphs of your Virtual Wiring devices? There's a Virtual Wiring application for graphing. Using the Virtual Wiring graphing application, you can create graphs of your Virtual Wiring values. Much like Virtual Wiring, the graphing application runs as a standalone web server, and you can use it with most any browser. The graphing software can graph multiple values at once, and it can even graph values from multiple Virtual Wiring Systems at once. Graphs can be drawn over a variety of intervals - from short intervals (hours) to longer intervals (months). To use the Virtual Wiring graphing software, you'll need to download the application and install it. As is the case for the Virtual Wiring application, the graphing software runs on most *nix hosts. Often, people will run the graphing software and the Virtual Wiring system on the same host. InstallationInstall RubyBefore installing the graphing software, you will need to have Ruby installed on your host system. If you are planning on running the graphing software on the same system you are running Virtual Wiring, you are all set. If you are installing the graphing software on a host which does not have Ruby installed, install Ruby on the host. If you are unsure about how to install Ruby, see the Installing Ruby for Virtual Wiring page (installing Ruby is identical for both applications). Install rrdtool and curlThe graphing software makes use of 2 other applications. One, rrdtool, is a tiny database program suited for running small databases on small systems. We'll use rrdtool to store and retrieve the values in our graphs. The other application, curl, we use for reading values from our Virtual Wiring systems. To install them both, open a terminal on your host and type: If you encounter protection violations, try using sudo: Note: If your *nix system does not use the apt-get package management system, try snooping around on the web for other ways to install these 2 programs. Both are open source and have been ported to many different platforms. curl may already be on your *nix host (it's commonly installed on *nix systems). Download the Graphing SoftwareThe Virtual Wiring graphing software is available as a download from the Virtual Wiring Downloads page. The application is a zip file named vw_grapher_yyyymmdd.zip, where yyyymmdd is the date the graphing program was released (yyyy is the year, mm is the month, and dd is the day). To download the software, go to the Downloads page, read the licensing agreement, and if you agree to it, click on the agree button and click on the download button for the software. Install the Graphing SoftwareOnce you have downloaded the software, move the downloaded zip file into whatever directory you would like for your graphing software. Then unzip your downloaded file (substitute your own yyyymmdd): 'cd' into your newly created vw_grapher_yyyymmdd directory and type: Your computer will churn on this for a little while, and then you will be good to go. If you encounter problems, make sure you followed all the steps when installing Ruby. Forgetting to install 'bundler' or not installing the 'ruby-dev' package is easy to overlook. Running the SoftwareAfter you've finished installing the software, you should be in your vw_grapher_yyyymmdd directory. From within the graphing directory type: After a few seconds, your software should be up and running. Open your host's browser (Firefox, Safari, Midori, Epiphany, ...) and navigate to localhost:4568. You should see the Virtual Wiring graphing page. It will look something like this: 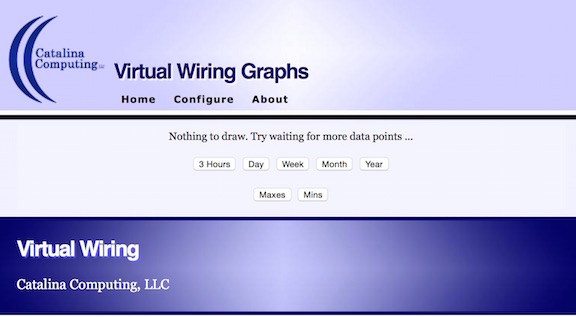
There's not a lot going on here (yet!). To make things more interesting, we'll need to configure the software (later in the configuration section). Duration ButtonsYou can control the time duration of your graphs. Notice near the bottom of your graphs page, there are buttons labeled "3 Hours", "Day", "Week", .... When you click on a button, it will show your graphs over that time interval. So, for example, clicking the "Year" button will graph your values over the last year. Maxes and MinsUnderneath the duration buttons, there are 2 buttons labeled "Maxes" and "Mins". These buttons allow a special type of graphing: they graph your maximum values or your minimum values. What's going on here? Because there can be so many points on a graph, the database software finds ways of compressing them into fewer values. By default, it averages values together, which makes sense, since graphs tend to change their values rather slowly. However, if there are graphs which jump around a lot, you may not want your high or low values averaged away. The Maxes and Mins buttons preserve highs and lows. So if you have a big spike in your data that only lasts a short while, you'll be able to see it as a maximum or a minimum. Max and Min graphs are always graphed over a 1 month duration. Configuring the SoftwareThe graphing application has a configuration page for configuring itself. The configuration page lets you define the title of the page and what gets graphed. Go to your configuration page by clicking on "Configure" at the top of the graphing application's web page. 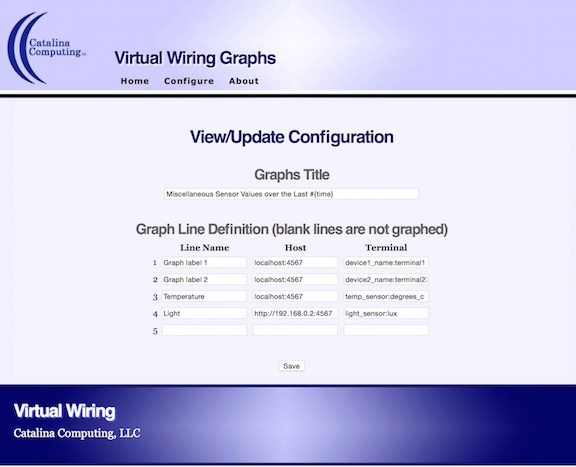
The application starts up with some default values which illustrate how configuration works. The "Graphs Title" FieldNotice at the top of the configuration page, there's a box labeled "Graphs Title". This box lets you type in the label you want see at the top of your graphs. The value shown here says: Everything in the title box will printed as a title at the top of your graphs. Notice the special string, So using The "Graph Line Definition" FieldsThese fields let you define what gets graphed. The "Line Name" field gives your graph a name. The "Host" field says what host and port your graph data will come from (yes, you can get data from any Virtual Wiring host accessible from your network). The "Terminal" field says what terminal the data will be coming from. So if you wanted a graph called "My Light" of terminal "1S" of device "light", and the Virtual Wiring software was running on port 4567 on the same host as the graphing software, your fields would be as follows: You can display up to five graphs at one time. If you don't have 5 graphs, delete all the fields in your unused definitions. In the configuration screen shown above, there are 4 graphs (line 5 is blanked out). A Test SystemTo better illustrate how the graphing software works, we'll create a real Virtual Wiring system and some graphs. Because we don't want to use any hardware, we'll build a system out of Virtual Devices, so you can run it on any system. To get started, we'll assume you have a host running both the Virtual Wiring software and the graphing software. Within the Virtual Wiring system, we'll create 3 pseudo random data sources, representing 3 temperature sensors. We'll build the "sensors" out of Mappers using a function that generates pseudo random numbers. A sensor gets built like this: This "sensor" will output random values from 73 to 76.9 (inclusive). To tell the "sensors" when to generate a new value, we'll need to create events. We'll use a Triangle Waveform Device generating values once per minute. We don't care about the actual triangle values - we are just using them to generate our pseudo random temperatures. We'll wire the Triangle Device to each of our 3 "sensors", so all 3 generate events once per second. Our complete test system Script looks like this: To create graphs of our system, we'll configure the graphing software as follows: 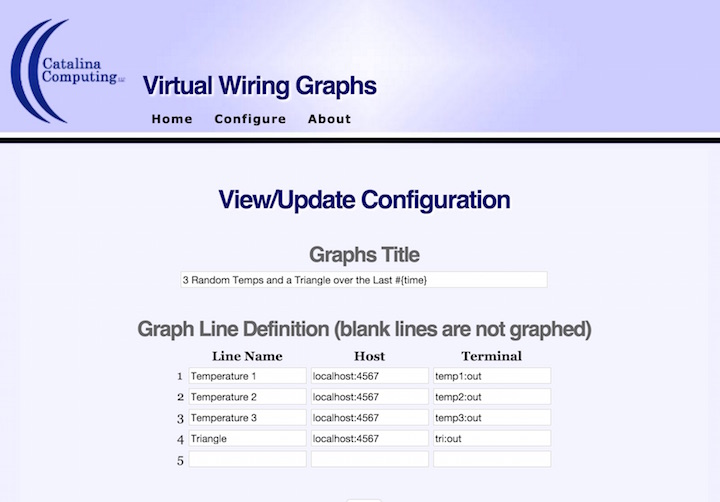
After about 20 minutes, our graphs looked like this: 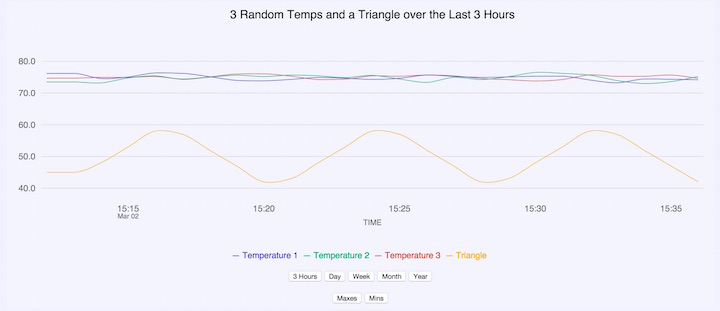
Wrap UpLooking Around the SystemIf you are curious about how things work, there are lots of things to study and learn. The software is all quite readable (it's Ruby), so you can see exactly what it does. If you are looking for more of a "shallow dive", take a look at the config/apps.rb file. It's got some interesting configuration values which control how graphing gets done. Restarting from ScratchWant to toss out all your graphing data and start again? You'll need to get a fresh database and configuration. Both your configuration and your data live in the "database" directory at the top of your graphing directory. The database is in a file called database.rrd. The configuration is in a file called configuration.json. If you want to get rid of your graph data, stop the graphing software (a control-c at the command line usually does the trick) and delete the database.rrd file. Then restart the graphing software, and it will create a clean new database. If you want to get rid of your configuration, stop the graphing software and delete the configuration.json file. When you restart the graphing software, it will create a new default configuration file. Changing the Default PortBy default, the graphing program web server uses port 4568. If you want your graphs to appear at a different port, use the -p option. So if you wanted your graphs to appear at port 5678, run the program like this: Upgrading Your Graphing SoftwareFrom time to time, we will improve the graphing program and put the latest version into our downloads area. If you want to upgrade to the latest version and don't wish to keep your graphing and configuration data, stop the older graphing program (if you haven't already) and install and start up the newest one. If you wish to upgrade and keep your graphing and configuration data:
Once the new software starts up, it checks for pre-existing database and configuration files. If it finds them, it uses them. |
Catalina Computing, LLC.Copyright © Catalina Computing, LLC. (2013-2018) 
|
Page last updated: Tue Mar 22 19:41:32 2016 (UTC) |